
 N3H-X16US 16KW | Split Phase |...
  N3H-X12US 12KW | Split Phase |...
  N3H-X10US 10KW | Split Phase |...
  N3H-X8US 8KW | Split Phase | ...
  N3H-X5US 5KW | Split Phase | ...
  N1F-A3US 3KW | Split Phase | ...
  N1F-A12US 12KW | Split Phase |...
  N1F-A6.5US 6.5KW | Split Phase ...
  N1F-A6.2P 6.2KW | Single Phase...
  N1F-A6.2E 6.2KW | Single Phase...
  AMF16000 51.2V | 16KWH | Floo...
 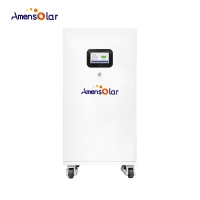 AMW10240 51.2V | 10.24KWH | W...
 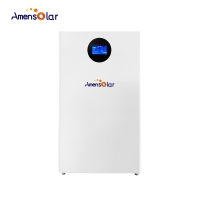 LFP 16kWh / LV 51.2V | 16KWH | Floo...
 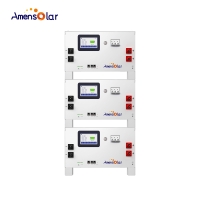 S52300 51.2V | 16KWH | Stac...
 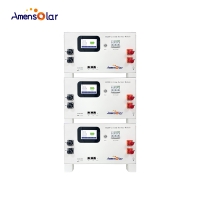 S52200 51.2V | 10.24KWH | S...
 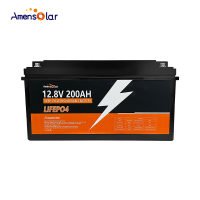 AML12-200 12.8V Series LifePo4...
 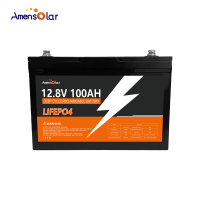 AML12-100 12.8V Series LifePo4...
 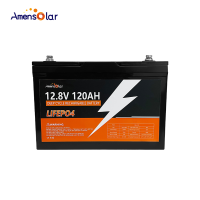 AML12-120 12.8V Series LifePo4...
 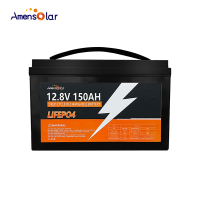 AML12-150 12.8V Series LifePo4...
 Understanding the Market Positioning of Energy Storage Products in Different Countries
1. Chart Interpretation
Horizontal Axis (GDP per Capita): Indicates economic development level. Higher GDP per capita suggests stronger consumer purchasing power.
Vertical Axis (Consumption Ratio): Reflects the significance of consumption in economic activities. A higher ratio suggests a greater willingness to spend.

2. National Distribution and Energy Storage Purchasing Power Stages
Based on the distribution of countries in the chart, energy storage purchasing power can be categorized into the following stages:
(1) High Purchasing Power Stage
Representative Countries: United States, Switzerland, Norway, Singapore, Luxembourg.
Characteristics:
GDP per capita exceeds $50,000, indicating strong purchasing power.
Moderate to low consumption ratio (40%-60%), suggesting a mature consumption structure where energy storage is often used in premium markets and smart home applications.
Market Potential: High demand for advanced energy storage solutions with a focus on performance and brand reputation.
(2) Upper-Mid Purchasing Power Stage
Representative Countries: Germany, Australia, Canada, United Kingdom, France, Japan.
Characteristics:
GDP per capita ranges from $30,000 to $50,000, reflecting considerable consumer spending capacity.
Moderate consumption ratio (50%-60%), indicating a strong willingness to invest in energy solutions.
Market Potential: Stable demand, making it suitable for mid-to-high-end energy storage products.
(3) Mid Purchasing Power Stage
Representative Countries: South Korea, Saudi Arabia, Turkey, Thailand.
Characteristics:
GDP per capita between $10,000 and $30,000, with growing purchasing power.
Moderate to high consumption ratio (50%-60%), reflecting strong consumer interest in cost-effective solutions.
Market Potential: Ideal for competitively priced energy storage products, with rapid market growth potential.
(4) Low Purchasing Power Stage
Representative Countries: India, Vietnam, Philippines, Egypt, South Africa.
Characteristics:
GDP per capita below $10,000, indicating limited purchasing power.
High consumption ratio (60%-70%), with spending focused on essential goods, leading to lower demand for energy storage.
Market Potential: Early-stage market with opportunities for low-cost, entry-level energy storage solutions, potentially supported by government subsidies and aid programs.
3. Market Strategies for Energy Storage Products
High-Purchasing Power Markets: Focus on premium products, emphasizing technological innovation and brand prestige.
Upper-Mid Purchasing Power Markets: Promote mid-to-high-end solutions, balancing cost-effectiveness with advanced features.
Mid Purchasing Power Markets: Offer affordable energy storage systems to cater to households and small businesses.
Low Purchasing Power Markets: Develop cost-efficient products and leverage government incentives to drive adoption.
Contact Information
Resource
Copyright © 2010-2025 Amensolar. All Rights Reserved.